| # | User Site ID | Sensor Type | Depth | # Records | Min | Max | Mean | Std. Dev. | MAST | MSST | MWST | MSST-MWST |
|---|
 Loading...
Graph tips:
- Hover mouse over graph to see specific sensor values at upper right.
- Click and drag mouse to display data for a specific time period.
- Hold Shift key and drag mouse to pan graph.
- Double click to restore graph to full time period.
- Enter values in the text box at lower left to average data over the specified number of data points (useful for smoothing out data).
Sorry, you don't have access to this feature. To upload data, you need to Sign in.
To obtain user access, see the User access help.
| User Site ID | Project | Sensor Type | Depth |
|---|
About
The Henry Mount Soil Temperature and Water database was created to store soil climate data collected by NRCS staff from in-ground sensors ("HOBOs") and weather stations (Onset Weather Station). The "Henry" database can currently accept soil temperature, soil moisture (volumetric water content), and air temperature data. Pending future funding, there are plans to add support for precipitation and water table depth. This database does not house data collected as part of the SCAN or SNOTEL network of stations.
There are several ways to interact with the Henry database:
- This website provides a simple interface to searching, summarizing, and uploading new soil climate data.
- The fetchHenry() function from the soilDB R package provides a more advanced interface to large collections of data. See the fetchHenry() tutorial for a more detailed explanation.
- HTTP requests with query parameters as URL arguments--advanced users.
Database Design
The Henry database is composed to two main sets of tables: the sensor table which houses sensor/site metadata, and the soil_temperature/soil_vwc/air_temperature tables which house uploaded sensor data. Sensor metadata (e.g. rows in the sensor table) must be uniquely identified by the combination of NASIS user site id / sensor type / sensor depth.

Pending future funding, all sensor metadata additions or edits must be manually applied. Please send a CSV file formatted as follows to Dylan Beaudette. Note that the "sid" column (internally generated "sensor ID") should be blank for new sensors and left as-is for existing sensors.
| mlra_sso | user_site_id | name | serial_number | sensor_type | sensor_depth | model | wgs84_longitude | wgs84_latitude | project | sid |
|---|---|---|---|---|---|---|---|---|---|---|
| 2-SON | S2013CA019003 | Roadsend | 10198612 | soiltemp | 50 | onset_u30station | -118.66 | 36.79 | CA792 | 215 |
| 2-SON | S2013CA019003 | Roadsend | 10198607 | soiltemp | 8 | onset_u30station | -118.66 | 36.79 | CA792 | 734 |
| 2-SON | S2013CA019003 | Roadsend | 10198608 | soiltemp | 20 | onset_u30station | -118.66 | 36.79 | CA792 | 735 |
| 2-SON | S2013CA019003 | Roadsend | 10198613 | soiltemp | 100 | onset_u30station | -118.66 | 36.79 | CA792 | 736 |
| 2-SON | S2013CA019003 | Roadsend | 10199215 | airtemp | onset_u30station | -118.66 | 36.79 | CA792 | 737 | |
| 2-SON | S2013CA019003 | Roadsend | 10200062 | soilVWC | 8 | onset_u30station | -118.66 | 36.79 | CA792 | 738 |
| 2-SON | S2013CA019003 | Roadsend | 10200063 | soilVWC | 20 | onset_u30station | -118.66 | 36.79 | CA792 | 739 |
| 2-SON | S2013CA019003 | Roadsend | 10200065 | soilVWC | 50 | onset_u30station | -118.66 | 36.79 | CA792 | 740 |
| 2-SON | S2013CA019003 | Roadsend | 10200079 | soilVWC | 100 | onset_u30station | -118.66 | 36.79 | CA792 | 741 |
| 2-SON | 2015CA6304010 | dylan under canopy | 202059 | soiltemp | 50 | onset_h0800102 | -120.42 | 38.04 | CA630 | 283 |
Upload Formats
Data can be uploaded using two possible file formats. The "single sensor" format is very similar to the data exported from single-sensor ONSET devices, such as the older "HOBO" loggers. The "multiple sensor" format is the most flexible, however, final editing of the user site ID and column names must be done in a text editor.
Single Sensor
Column headings are optional. Columns can be split by comma or TAB characters.
datetime,value
07/16/15 00:23:21.0,20.95
07/16/15 04:23:21.0,20.95
07/16/15 08:23:21.0,20.95
...
Multiple Sensor
This file format is a CSV file with an additional line added at the top, with the NASIS user site ID. Adding this top line is only possible in a text editor.
Template[user_site_id] datetime,[sensortype]_[depth]cm, ... other sensors ... [sensor data here]
Complex File
S2013CA019002
datetime,soiltemp_10cm,soiltemp_20cm,soiltemp_50cm,soiltemp_100cm,airtemp,soilVWC_10cm,soilVWC_20cm,soilVWC_50cm,soilVWC_100cm
01/22/2015 16:00:00,10.296,11.370,14.649,17.415,6.687,0.1342,0.1020,0.0247,0.1091
01/22/2015 18:00:00,10.075,11.467,14.697,17.463,5.102,0.1317,0.0998,0.0252,0.1096
01/22/2015 20:00:00,9.089,11.370,14.721,17.463,10.956,0.1326,0.1014,0.0261,0.1101
...
Simple File
S2013CA019002
datetime,soiltemp_10cm
01/22/2015 16:00:00,10.296
01/22/2015 18:00:00,10.075
01/22/2015 20:00:00,9.089
...
Water Level Notes
- Water level should be encoded as an offset (cm) from the soil surface (0cm). Water levels below the soil surface should use negative values and standing water (above the soil surface) should use positive values.
- Be sure to correct water level values via surface air pressure measurements before uploading.
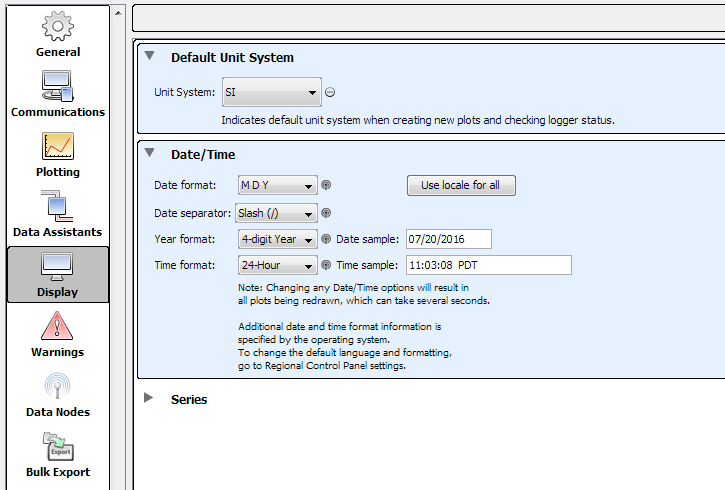
ONSET File Export Settings
Data preparation for upload to the Henry DB is much simpler after adjusting file export settings in "HoboWare". Make adjustments based on the following figures: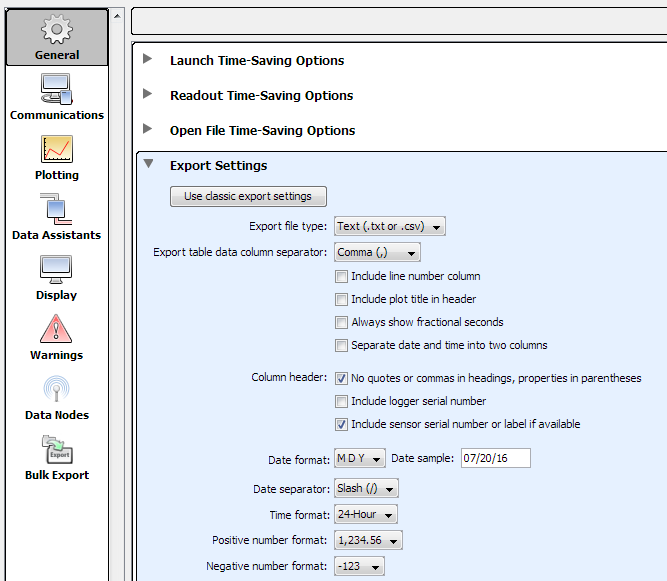
Sensor Legend
| Air temperature | |
| Air pressure | |
| Soil temperature | |
| Soil VWC | |
| Soil water potential | |
| Precipitation | |
| Water level | |
| Selected sensor | |
| 5 | Clustered sensors (click to zoom in) |